
Similar to Network Watcher, Time Watcher measures the time of execution for a specified part of a script and alerts if the threshold has been exceeded. For example, you need to measure only the 4th step of the 10- steps script, which is the load time of a shopping cart at your online store.
To enable Time Watcher:
- Right-click the line (step), after which Time Watcher should start measures.
- Select Measure Time > Script > Start.
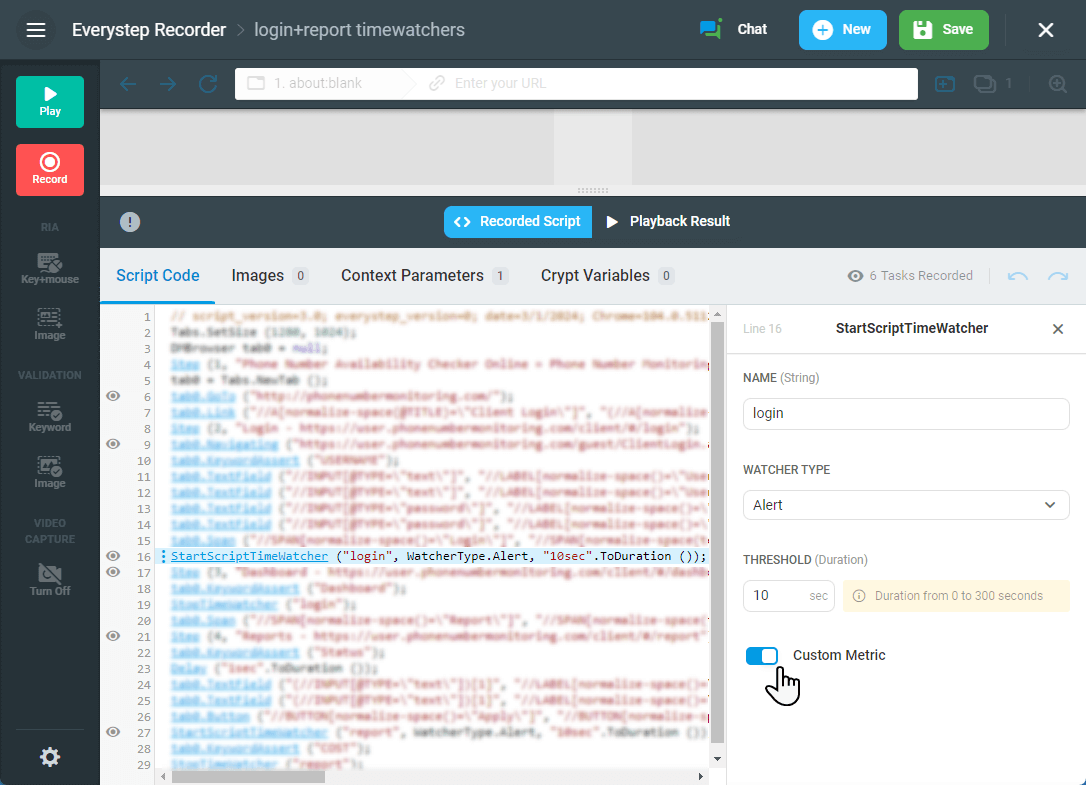
- Optional 1: Specify the watcher parameters on the editing pane, located to the left of the script code area.
- Optional 2: To collect, process and aggregate Script Time Watcher results as a custom metric, ensure that you enable the Custom Metric option in the Time Watcher settings. Please visit the Custom Metrics in Web App Performance Monitoring and Load Testing article of our wiki to find more details on the custom metric analysis.
- Right-click the line, after which the measurement must be stopped. Select Measure Time > Script > Stop, and choose the name of the watcher to close.
If you have been using the Time Watcher function in your load testing scripts and want to gather the watcher statistics based on all test sessions executed within the test, visit the Time Watcher Statistics article of this wiki.