
Similar to Time Watcher, Network Watcher allows measuring the load time of network elements during the execution of a certain range of steps within a monitoring script, grouped by type (set a mask, like *.png, *.js, etc.).
To enable Network Watcher:
- Right-click the line (step), after which Network Watcher should start measures.
- Select Measure Time > Network > Start.
- Optional 1: Specify the watcher parameters on the editing pane, located to the left of the script code area.
- Optional 2: To collect, process, and aggregate Network Watcher results as a custom metric, ensure that you enable the Custom Metric option in the Network Watcher settings.
- Please visit the Custom Metrics in Web App Performance Testing article of our wiki to find more details on the custom metric analysis.
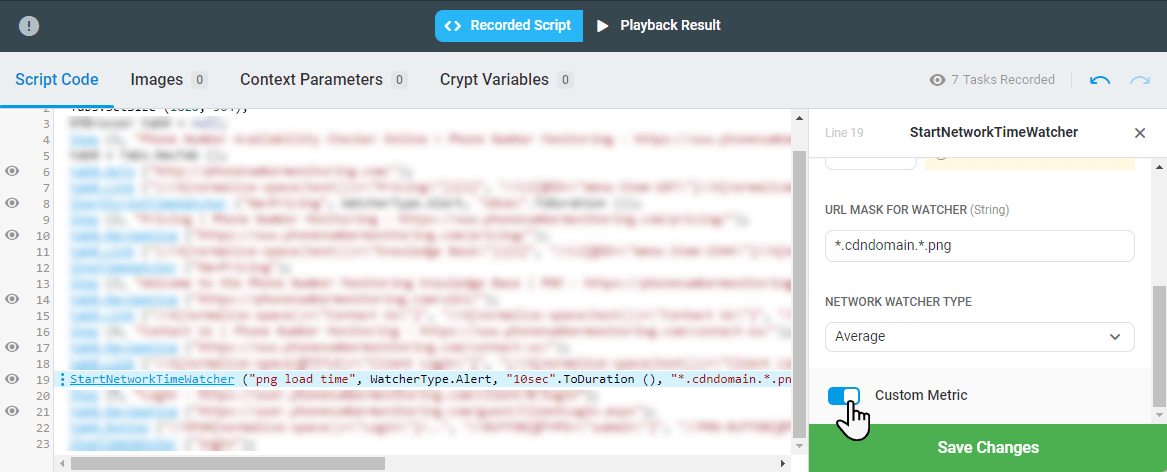
- Select a type to define how to apply threshold value:
- Sum – apply the threshold to the sum of load times of all requests.
- Average – apply the threshold to the arithmetic average of all requests.
- Each – apply the threshold to each request.
- Right-click the line, after which the measurement must be stopped, select Measure Time > Network > Stop, and choose the name of the watcher to close.
Let’s assume we have an online store that relies on CDN where some of the portal images are placed. We want to measure if this particular CDN satisfies our claims regarding the speed of load.
All we need is to add Network Watcher configured to measure the load time of images for this CDN.
Image URLs have the next format:
http://1ba0.cdndomain.com/abc/1234567/image_1.png
http://f4d4.cdndomain.net/kh3/1234567/image_2.png
In this case URL mask for Watcher has to be:
*.cdndomain.*.png